10.08.2026
 636
636
636
How IoT dashboards turn metering data into management decisions
636
As the number of connected devices in utility infrastructure grows, the role of metering data is changing. Previously, the main task was to obtain meter readings and transfer them to the billing system, but service providers, property management companies, and infrastructure operators now work in a much more complex environment.
A modern metering system generates not only resource consumption data, but also information about device status, connection quality, security events, network operation, and operational deviations.
According to IoT Analytics, the number of connected IoT devices worldwide will approach 39 billion by 2030. At the same time, the number of intelligent metering devices is also growing, with the market research company Counterpoint forecasting that within the same timeframe the installed base of smart meters will reach 3 billion.
In these conditions, the key task of metering systems is no longer simply data collection, but data interpretation and its use for decision-making. The use of IoT dashboards for smart metering help successfully address this task.
In the traditional metering model, data is collected periodically and used mainly to calculate consumption. This approach works well as long as the number of sites and the volume of information remain limited.
Modern remote metering systems using smart metering data dashboards work differently. A single meter can transmit not only current readings, but also consumption logs, diagnostic data, battery status information, tampering attempts, signal quality, and other parameters.
However, when tens of thousands of devices are involved, the data flow becomes so large that manual analysis is impossible. As a result, the organization has a huge amount of valuable information, but doesn’t gain management value from it.
An IoT dashboard solves this problem by turning a flow of fragmented data into a clear picture of infrastructure status, helping to quickly identify events that require attention.
In practice, remote metering data can be divided into several groups.
The first group is consumption data itself. This includes meter readings, hourly and daily archives, resource consumption dynamics, and statistics by site.
The second group is the technical condition of devices. This includes battery level, connection availability, time of the last data transmission, radio signal parameters, and equipment status.
The third group is events and alarms. For example, tampering attempts, enclosure opening, sensor connection interruption, missed data transmission, or other abnormal situations.
Individually, each of these categories has limited value, but when analyzed together, they provide significant and valuable insights into the management of the system. For example, a decrease in consumption could be related to an actual change in resource usage or to a loss of connection with the device. Without the context that a modern metering system brings, these situations will look the same, even though they require completely different actions.
The main difference between an IoT dashboard and a regular set of charts is that it helps connect data points to each other.
The chain can be represented as follows (using Jooby products as an example):
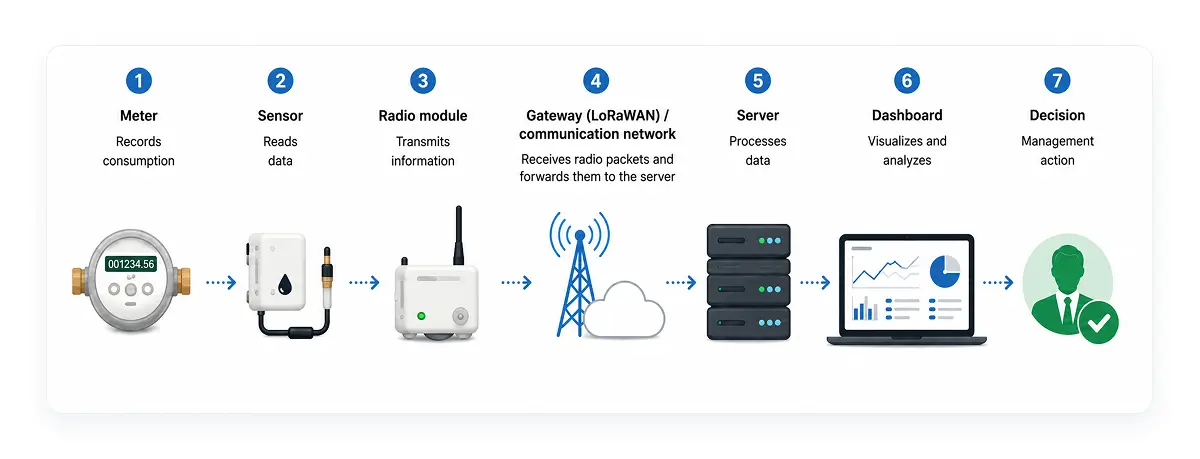
At each stage, the data undergoes additional processing. If the meter records only the fact of consumption, the dashboard shows already interpreted information: where a deviation occurred, how critical it is, and whether intervention is required.
That’s why a good IoT dashboard doesn’t answer the question of what happened, but rather, what needs to be done.
One of the most in-demand functions of IoT dashboards is consumption analysis. If data is only displayed at the level of individual meters, the operator receives thousands of independent values, an approach that does little to support management.
Instead, a dashboard allows information to be aggregated by sites, districts, consumer types, or device groups. As a result, it becomes possible to quickly see changes in the consumption profile and identify areas that require additional analysis.
The system can show:
A dashboard’s utility data management and analysis helps make decisions not only within the operation of the metering system, but also in resource planning, infrastructure modernization, and the preparation of investment programs.
Another important scenario is related to detecting leaks and unusual consumption. With an outdated approach, a leak may remain unnoticed until the next billing period. And if data is collected once a month, the problem is detected only after resource losses have become significant.
Remote metering and water usage analytics make it possible to work differently. If the system receives hourly data, the dashboard can detect atypical behavior patterns. This could be constant consumption at night which may indicate a hidden leak, or a sudden change in the consumption profile that points to equipment failure or unauthorized interference.
Instead of waiting for the next report, the operator receives a notification almost immediately after the deviation appears. It’s important that the dashboard does not necessarily have to make an automatic diagnosis, instead, its task is to draw the user’s attention to an event that falls outside normal system behavior.
This significantly reduces the time between the emergence of a problem and the beginning of the response to it.
Any remote metering system consists of more than just meters. It includes sensors, radio modules, gateways, data transmission networks, and server infrastructure. Even if consumption is displayed correctly, it doesn’t always mean that the entire system is operating without deviations.
One of the tasks of an IoT dashboard is to provide transparency into the state of the infrastructure. In practice, the operator needs to understand:
This is especially relevant for LoRaWAN networks, where data transmission quality can be affected by building characteristics, changes in the radio environment, or growing infrastructure load.
If the operator sees only the absence of data, it’s difficult to determine the cause of the problem. The dashboard allows incidents to be quickly divided into categories: a communication issue, a device issue, a sensor issue, or an actual absence of consumption. As a result, the number of unnecessary site visits decreases and troubleshooting becomes faster.
The traditional operation of engineering infrastructure is often based on a calendar principle, where equipment is serviced after a fixed period of time regardless of its actual condition.
IoT data analysis tools enable the transition to condition-based maintenance. If the system detects deteriorating connection quality, unstable device operation, frequent transmission errors, or a decreasing battery level, it can indicate the need for maintenance in advance. This makes it possible to:
For large metering systems that include thousands or even tens of thousands of devices, this can have a significant impact on operational efficiency.
Despite the development of monitoring and IoT analytics for utilities, one of the key tasks of metering systems remains the generation of correct data for calculations. However, even here the role of the dashboard goes far beyond visualization.
Before data is transferred to the billing system, it’s necessary to understand:
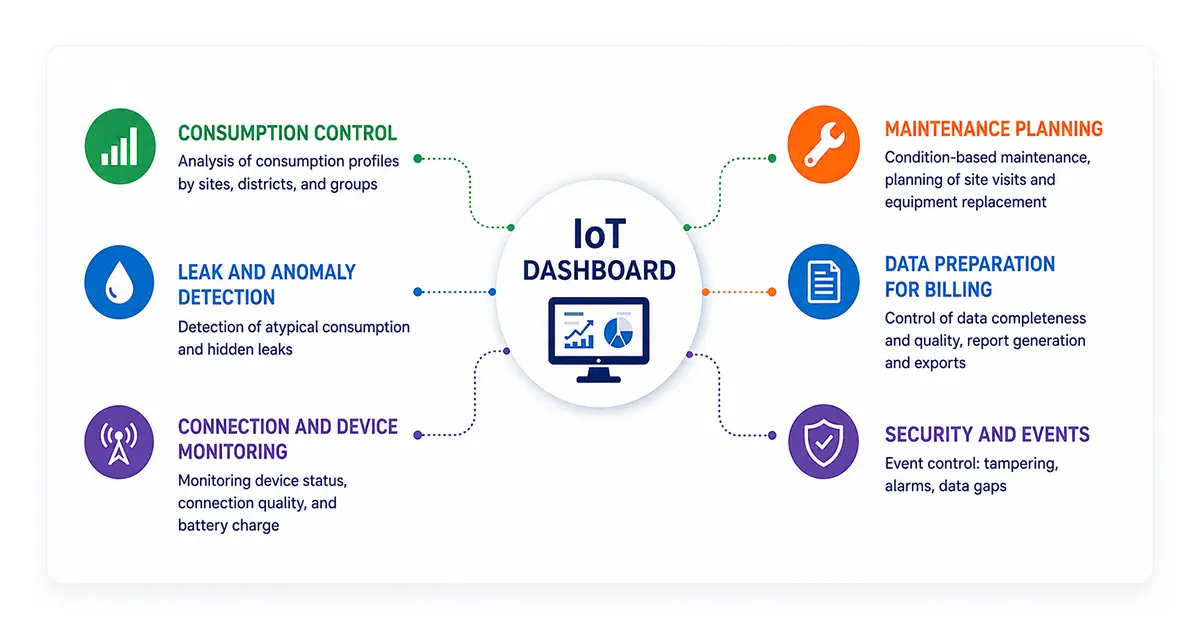
Management scenarios around an IoT dashboard
In essence, how IoT dashboards work is that they become a tool for data quality control. This is particularly important in large projects, where metering errors can affect thousands of consumers and lead to additional costs for recalculations and handling customer requests.
One common mistake when implementing IoT platforms is to use the data visualization tools to display the maximum possible number of charts and indicators on the screen. In practice, this approach rarely helps management. The focus should instead be on metrics that are directly related to operational and business processes.
For metering systems, the following KPIs are typically used:
This set of indicators makes it possible to move from observing infrastructure to actively managing it.
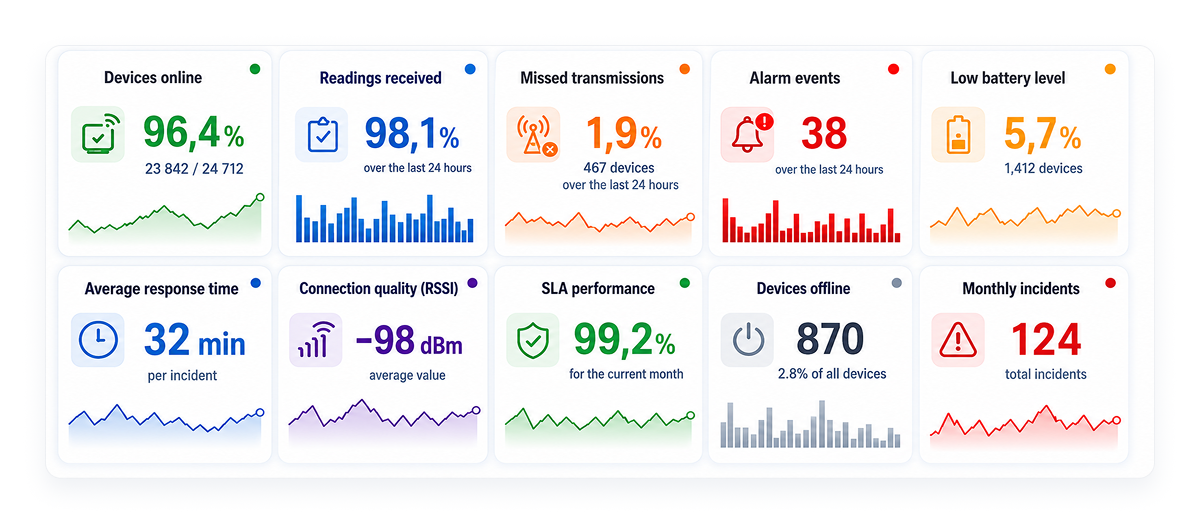
Example of a KPI panel on an IoT dashboard (illustrative values)
To make impactful, data-driven decisions, a platform is needed that brings together information from all elements of the metering system. In the Jooby ecosystem, this function is performed by the Jooby CMS platform.
The platform allows users to work using real-time monitoring, with data coming from smart meters, sensors, radio modules, and network infrastructure. In a single interface, the operator gains access to meter readings, consumption logs, device statuses, events, notifications, and analytical tools.
An important feature of utility data dashboards is their ability to work with different communication technologies at the same time. Depending on the project architecture, data may come through LoRaWAN or NB-IoT, while the platform ensures centralized collection and processing. For operations teams, this means they can monitor the metering infrastructure as a unified system rather than as a set of fragmented devices.
As IoT systems develop, the volume of collected data continues to grow. However, for it to be of value, you need to turn IoT data into insights that inform decision making.
Using smart metering analytics, IoT energy management dashboards facilitate this process, allowing resource consumption to be monitored, leaks and anomalies to be detected, a device’s status to be tracked, maintenance to be planned, and ensuring that data quality for billing purposes is maintained.
Comprehensive solutions with smart meters, sensors, radio modules, gateways, and a management platform build a continuous chain from consumption measurement to management action, turning remote metering into an efficient infrastructure management system.
Was it helpful?
 118
118


Stay on top of the latest industry news
Thank you, we have received your message. Our manager will contact you shortly.


Thank you, we have accepted your request. In the near future the responsible manager will contact you and clarify the details of the order.