05.11.2026
 17
17
LoRaWAN for Predicting Gas and Water Meter Failures
17
Problems with utility metering often become apparent through their consequences: readings stop changing, bills raise questions, and the gap between building-level and individual consumption grows. By that point, it can be difficult to determine when the deviation began and what caused it — a faulty meter, a data transmission issue, or a change in consumption.
Remote meter monitoring and reading helps identify these situations earlier. In addition to consumption volumes, compatible equipment can transmit information about meter battery status, sensor connections, and other events. This real-time meter data enables a shift in utility equipment failure detection, from inspections triggered by complaints, to condition-based maintenance.
However, LoRaWAN is a communication technology, not a prediction algorithm. The ability to identify a risk of failure in advance using smart meter monitoring depends on the equipment’s diagnostic capabilities, data quality, and the methods used to analyse it. Utility providers, municipalities and homeowners associations need to understand this distinction for gas and water meter failure prediction before choosing a system.
Remote utility monitoring involves three distinct tasks. Event logging reports something that’s already happened, for example, a device detecting the removal of a radio module. Anomaly detection identifies unusual behaviour, such as readings that remain unchanged for an extended period or abnormal consumption patterns. Prediction estimates the likelihood of a future fault or the time remaining before a critical condition is reached.
These tasks require different information. Event logging requires an appropriate sensor and logic for processing the event. Detecting deviations requires rules, historical data, and operational context. Prediction requires indicators whose changes are linked to the development of a specific fault, along with a validated model of that relationship. This distinction is consistent with condition monitoring and predictive maintenance methodology.
For example, a low-battery warning helps schedule radio module maintenance but doesn’t indicate wear in the measuring mechanism. Readings that stop increasing may reflect a lack of consumption, missed pulses, or a faulty meter. A single indicator rarely establishes the cause with confidence.
The first practical benefit of implementation is therefore earlier problem detection and informed prioritisation of inspections. Prediction becomes possible when the data genuinely reflects the development of a fault, something that’s not guaranteed simply by accumulating a large archive of readings.
A meter with built-in connectivity, or a radio module connected to it, sends data through gateways and a network server to an application system. There, readings are compared with historical data, diagnostic events, and maintenance findings. Connectivity delivers the information, while analysis rules help determine which metering points require attention.
LoRaWAN is suited to small, periodic messages from devices with limited power budgets. However, it’s not designed for continuous transmission of large volumes of data and doesn’t, by itself, guarantee delivery of every message within a strict latency limit. These limitations need to be considered when selecting monitoring tasks.
The scale of deployment already supports the use of LoRaWAN as infrastructure for large projects. In December 2025, the LoRa Alliance reported more than 125 million deployed end devices (covering all industries, not just utility asset management), followed by 150 million in September 2026.
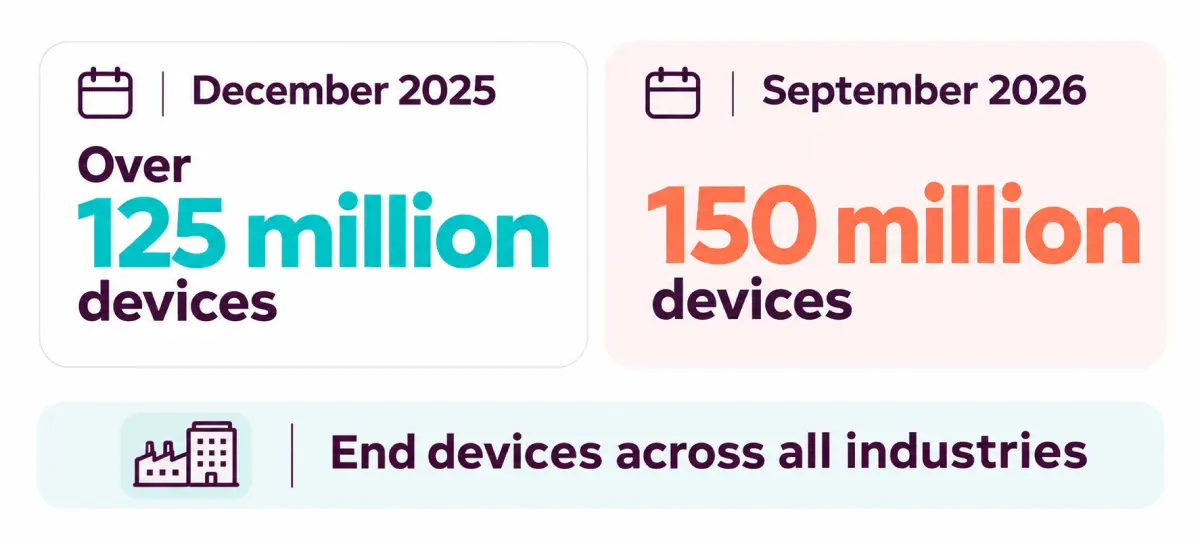
LoRaWAN: Deployment Scale in 2025–2026
The foundation of analysis is meter readings with accurate timestamps. It’s important to distinguish between the time of measurement and the time a message is received, as data arriving after a communication outage may describe consumption during previous hours. If treated as current data, it can create a false consumption spike in the system.
The second layer is equipment status. Depending on the model, available information may include battery status, module removal, magnetic interference, sensor connection faults, or internal meter errors. LoRaWAN connectivity doesn’t imply support for all these functions however, and the message contents must be checked against the documentation for the specific device.
The third layer covers connectivity and operation. Investigating missing data involves checking the time of the last message, gateway availability, and network reception metadata, including signal strength and signal-to-noise ratio. These metrics are usually generated by the receiving infrastructure. Analysing the meter also requires its model, installation date, settings, and maintenance history.
The limitations of retrofitting existing meters must also be considered. A pulse-counting radio module generally receives no direct information about mechanical wear or measurement error. So while it will expand monitoring capabilities at the metering point, it won’t turn a conventional meter into a fully self-diagnostic system.
Readings have stopped increasing, but messages are still arriving. Communication is working, but the cause has not yet been established. In an unoccupied apartment, this may be normal. If consumption is confirmed, the meter mechanism, sensor, mounting, and connection should be checked. Unchanged readings only justify an inspection when considered in context.
At low flow rates, the pulse value must be taken into account — the volume represented by a single pulse. Until that volume has passed through the meter, the radio module may not register a new value. A short period without an increase therefore doesn’t necessarily mean that the meter has stopped working.
Messages have stopped arriving. First, check radio coverage, gateway power and connectivity, server operation, and the condition of the radio module. If a group of devices previously received mainly by one gateway disappears at the same time, the shared infrastructure should be checked. However, a LoRaWAN device is generally not assigned to a single gateway: several gateways may receive its message.
Water consumption continues at night. If consumption previously stopped during these hours, a steady low flow may indicate a leak downstream of the meter. However, equipment operation or changes in how the premises are used can produce a similar pattern. This is a reason to investigate water consumption, not proof of a faulty meter.
Gas consumption has decreased. In a property with gas heating, possible causes include warmer weather, residents being away, or changes to boiler settings. Gas meter monitoring allows for the comparison of different periods while accounting for weather conditions and how the gas is used. Energy assessment methods also incorporate temperature data when analysing heating consumption.
Gas consumption analysis does not replace gas detection: a meter measures the volume passing through it, not the concentration of gas in a room. A consumption profile alone cannot reliably establish whether a dangerous leak is present.
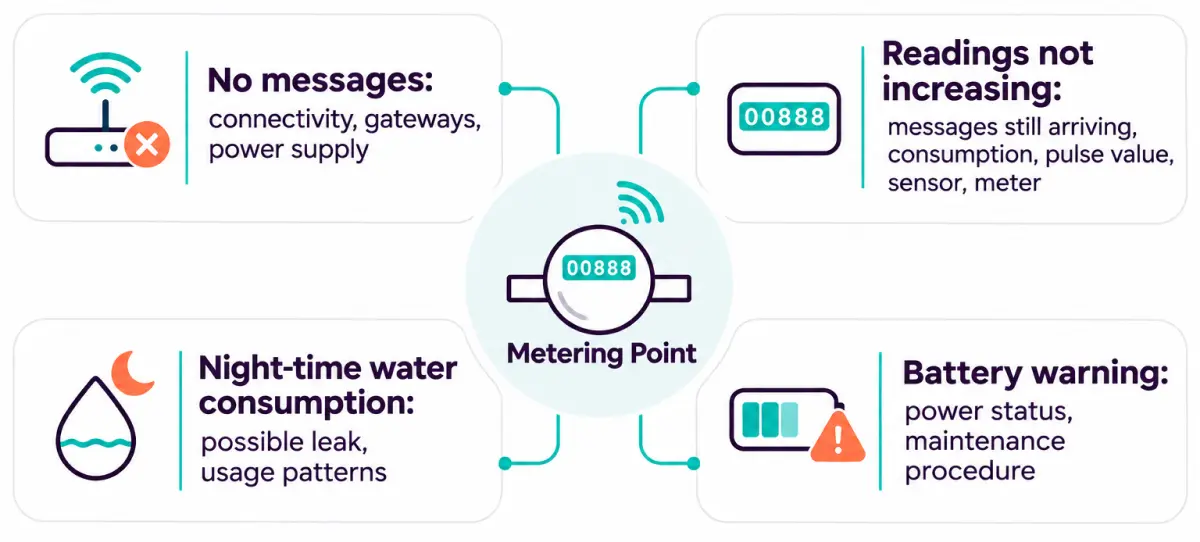
What to Check Before a Technician’s Visit
It makes sense to start with clear rules. For example, the system flags meters with prolonged data gaps or unusual consumption patterns. Thresholds are set according to the type of property, message frequency, and consumption characteristics. Applying the same rule for meter performance monitoring to a residential building, school, or seasonal property will produce different results.
The next step is to analyse combinations of indicators and how they change over time. Recurring events highlighted by sensor-based diagnostics, combined with deviations in readings, may increase the priority of an inspection. It’s also the case that a deteriorating radio signal reflects the condition of the communication channel and doesn’t necessarily demonstrate wear in the measuring mechanism.
A model trained on operational history requires verified outcomes, such as which equipment failed, when it happened, and what the technician found. A record stating “meter replaced” is insufficient, as the replacement may have been scheduled. Test results or a validated degradation model are other possible sources, but their applicability to the selected meters and operating conditions must also be confirmed.
LoRaWAN predictive maintenance and performance are evaluated on subsequent periods, without using future information when configuring the model. If the model is intended for use in other buildings or groups of meters, its performance must also be tested at those sites. This distinguishes genuine predictive capability from simply reproducing known data.
The practical question is: how many verified failures were predicted, how far in advance, and at the cost of how many unnecessary inspections? High overall accuracy offers little value if faults are rare and the system almost always reports that everything is normal.
Without either a verified failure history or a validated degradation model, it’s more accurate to describe the approach as anomaly detection in utility networks and condition-based maintenance. There’s no basis for promising a failure date solely from a consumption graph.
The frequency of recording readings and the frequency of sending messages are separate parameters. A device may store hourly values and transmit them less frequently, provided its memory and data format support this. This approach helps analyse consumption patterns, but the server will only detect a deviation after receiving the relevant records.
With transmission every four hours, data already recorded may wait almost four hours for the next scheduled transmission. This is not a guaranteed alert time, so delivery and the time the algorithm needs to detect a deviation must also be considered. For example, a rule that detects a prolonged absence of consumption first requires a sufficiently long observation period.
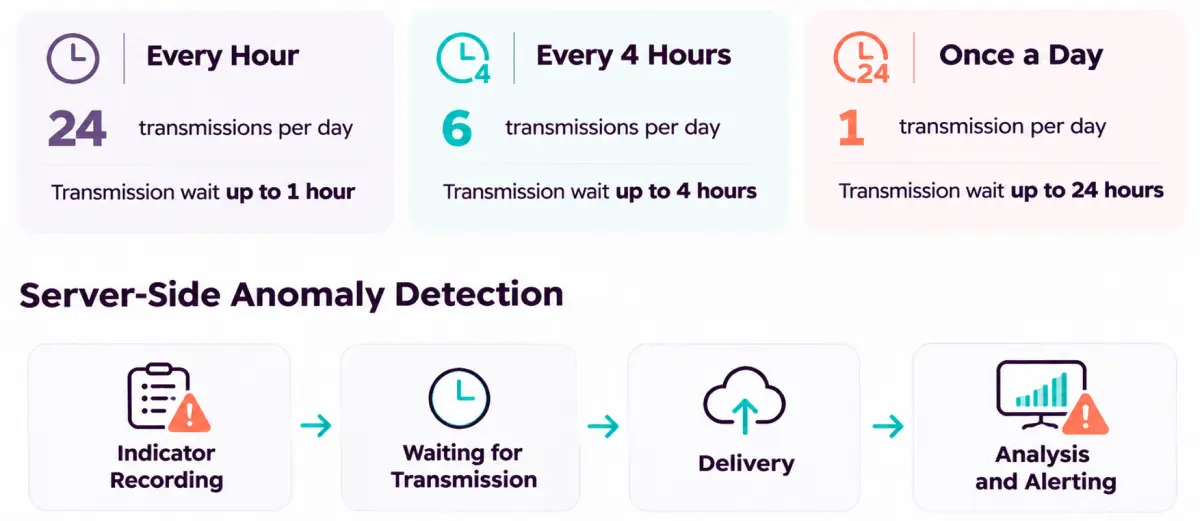
How Does the Transmission Interval Affect Alert Delay?
All things being equal, more frequent transmission increases energy consumption and radio airtime usage. Actual battery life also depends on communication parameters, message size, retransmissions and operating conditions. The transmission schedule should therefore suit the task, while support for sending event messages outside that schedule should be checked separately.
It’s also important to establish what happens after a communication outage: whether historical records are retained, how missing records are requested and whether the measurement sequence can be restored. The cumulative consumption total may remain available even when a detailed hourly consumption profile is missing.
Jooby RDC solutions allow compatible customer meters to be retrofitted with radio modules and LoRaWAN sensors for remote data collection. For example, the Jooby OMNI RM LoRaWAN 4PU 204 EU has four pulse inputs and supports input connection monitoring, battery status monitoring, and event logging. Jooby EPHIR RMS modules are available for compatible gas meters, with selected models detecting removal and magnetic interference.
This information can be used to identify deviations and schedule inspections. Event availability and interpretation should be confirmed for the specific device variant, sensor, and software version. Failure prediction requires separate analytical logic and validation of its performance: having a radio module does not mean having a ready-made predictive model.
A pilot project should cover conditions representative of future operation, including meters of different models and ages, basements, utility rooms, remote locations and properties with irregular consumption. Testing smart utility infrastructure only where connectivity is known to be good will not reveal the real maintenance challenges.
Baseline metrics and success criteria should be established before the pilot begins. Useful measures include data completeness by a specified deadline, problem detection delay, the proportion of verified alerts, and the number of unnecessary site visits. For prediction, the proportion of failures identified in advance and the time available for intervention should be measured separately.
The economic impact is calculated from actual changes. These may include the number of inspections that could be targeted, how much the period of unreliable metering was reduced, and costs that were incurred for connectivity, software, and maintenance. Detected leaks, meter faults, and transmission failures should be tracked separately, as their consequences and remedies differ.
For homeowners associations, the value may lie in fewer routine inspection rounds and faster resolution of disputes. For utility providers, it may lie in prioritising maintenance across a large meter fleet and equipment lifecycle management. Developers need to hand over an equipment register, settings, and event response procedures to the organisation responsible for operation. And in the case of municipalities, they need comparable metrics across properties and clearly assigned responsibility for resolving problems.
A short pilot can validate connectivity and alert handling, but it doesn’t always demonstrate the ability to predict rare failures. Observation duration alone is also insufficient: evaluation requires verified events and conditions representative of future operation.
LoRaWAN helps lay the foundation for early fault detection of gas and water meter problems by enabling regular collection of readings, visibility into diagnostic events, and comparison with operational history.
Practical value starts with reliable data and a clear procedure for investigating alerts. Prediction becomes justified when the available indicators are genuinely linked to developing faults and the model’s performance has been validated.
This approach to predictive maintenance for utilities enables maintenance planning within the equipment’s actual capabilities, as well as helping to avoid unnecessary replacements.
Was it helpful?
 2


Stay on top of the latest industry news
Thank you, we have received your message. Our manager will contact you shortly.


Thank you, we have accepted your request. In the near future the responsible manager will contact you and clarify the details of the order.