27.11.2025
 296
296
296
Big Data and LoRaWAN: how data from thousands of meters transforms resource management
296
The utilities sector is rapidly going digital: instead of occasional on-site visits and averaged norms, operators gain configurable telemetry, forecasting models, and real-time KPI control.
The pairing of Big Data and LoRaWAN – essentially LoRaWAN big data analytics within city-wide IoT infrastructure – has made this possible even on constrained budgets: the network provides energy-efficient long-range links, while an analysis platform turns the stream from thousands of meters into concrete decisions.
As a result, management companies, suppliers, and municipalities shift from “manual control” to a model where every kilowatt-hour, cubic meter, and gigacalorie is traceable, explainable, and optimizable – a foundation for utility digital transformation IoT.
LoRaWAN is designed for sparse, compact messages over long distances and in harsh locations, such as basements, pits, thermal substations, and metal cabinets. A single gateway covers districts and industrial zones, and devices run on batteries for 7–15 years. That means scaling from hundreds to tens of thousands of nodes without explosive OPEX.
Built-in cryptography (separate network and application keys, AES-128) simplifies compliance with security and data-protection requirements. Crucially, the transmit interval is remotely configurable, with the operator getting exactly the time series required for analytics (hourly, daily, event-driven) – ideal for real-time utility monitoring and meter telemetry.
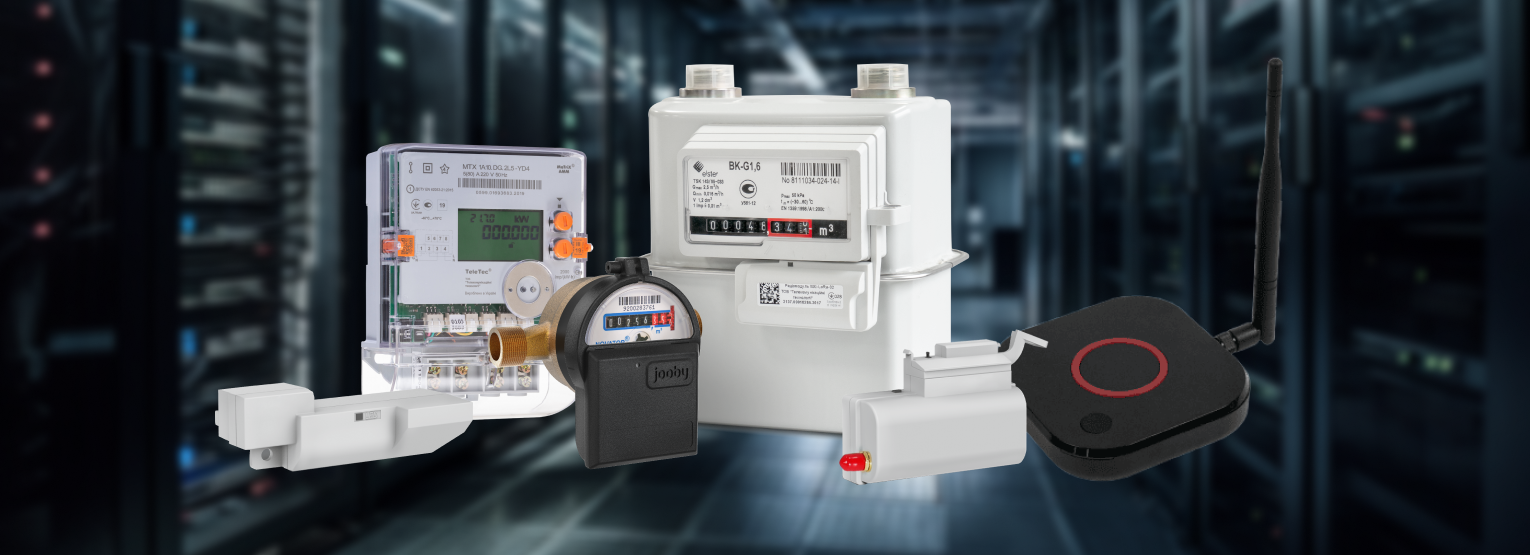
At the edge, meters with radio modules and sensors provide data regarding water, heat, gas, and electricity consumption; pressure and temperature; off-normal conditions and magnetic tamper, as well as motion and illuminance for street lighting.
Packets are sent to LoRaWAN gateways and then to the network server. After deduplication and validation, data lands in storage and BI marts, where load profiles are built, anomalies detected, and reports generated. Using cloud data pipelines in this way supports both transactional logic (accurate billing across tariff-change dates) and analytical logic (forecasts, KPI, optimization scenarios) – efficient IoT utility data management within an IoT data aggregation platform.
The most tangible effect is the disappearance of the “blind zone” between monthly snapshots. Interval telemetry reveals leaks, the “night breathing” of pressure, backflow, illegal taps, and driver degradation in street lights. Field crews are able to roll out on model alerts indicating the probable fault segment, which simplifies their work and cuts network maintenance costs. Mass reading rounds become unnecessary, emergency callouts drop, and dispatching moves into real time.
Savings accrue from several sources: reduced losses and pumping overheads, fewer penalties/litigation from disputed bills, optimized energy purchasing, and stretched capex thanks to predictive repair – all enabled by large-scale meter data processing and usage forecasting.
To move quickly from “pilot → production,” a unified, compatible stack matters. In Jooby’s lineup this looks like:
Jooby radio modules for water, heat, gas meters or smart electricity/water meters. These devices provide smart metering data insights and support flexible schedules, event flags (e.g. tamper, magnet, leak, reverse flow), sleep modes, and remote reconfiguration of transmit intervals.
Jooby Gateways (LoRaWAN) – base stations that collect traffic from thousands of nodes over secure channels with centralized management, aiding LoRaWAN network optimization.
Jooby RDC Dashboard – a cloud platform with IoT dashboards, alerts, event logs, and APIs for billing, ERP/SCADA, GIS, and BI integration. The platform computes data-quality KPIs (completeness, timeliness, plausibility), which is critical for before/after audits and decarbonization reports in AMI systems and city-wide IoT infrastructure.
For “big” data to work, devices are necessary but data discipline is decisive. Below are practices proven in deployments:
A single glossary and data catalog. Fix for each metric the units, pulse factors, event masks, DMA/TP zone dictionaries, firmware and configuration versions – boosting reproducibility and easing audits across consumption patterns.
Data quality at the platform level. Measure and monitor completeness/timeliness/plausibility; alert on silent nodes, counter rollbacks, anomalous joins, and RSSI/SNR degradation – strengthening network reliability and data accuracy.
Anomaly and forecasting models. With full incident archives, use supervised models (gradient boosting, random forest, LSTM for time series); with “young” archives, use unsupervised methods (Isolation Forest, autoencoders) and physico-statistical thresholds for pressure/flow/ΔT – supporting anomaly detection.
Closing the “data → action” loop. The algorithm should propose actions for utility automation: lower a PRV setpoint, shift pump starts, change dimming profiles, generate a work order with a geo-pin.
Security by default. OTAA with key rotation, TLS “gateway ↔ server,” backend segmentation, RBAC/MFA, immutable logs – reducing regulatory risk and building trust in digital metering across city-wide IoT infrastructure.
Water and distribution. DMA segmentation, pressure sensors, and telemetry from reduction valves cut background leakage, reduce water hammer, and speed up leak localization – central to non-revenue water reduction and IoT leak detection.
District heating. ΔT, flow, thermal power, and mixing-node monitoring enable operating balance, lower “overheating,” and reduce pump energy – improving resource optimization.
Gas. Pulse modules and tamper flags help reduce unaccounted gas and raise industrial safety.
Street lighting. Controllers and motion sensors enable adaptive “light on demand” dimming and reduce light pollution while maintaining safety.
LoRaWAN-based Big Data is a practical tool for those responsible for networks and budgets.
Regular telemetry from thousands of meters, unified protocols, and predictive analytics turn resource management into a transparent, reproducible process with measurable effects.
The Jooby stack – radio modules, gateways, and RDC Dashboard – helps move from pilot to city program without integration risks or waste. Most importantly, everyone benefits: suppliers get robust economics, municipalities get governed KPIs and access to green finance, and residents get better services and fair bills. This is how data becomes infrastructure – and infrastructure becomes a source of sustainable growth, powered by smart sensors, sensor networks, digital twins, and real-time utility monitoring.
Was it helpful?
 67
67


Stay on top of the latest industry news
Thank you, we have received your message. Our manager will contact you shortly.


Our experts are always happy to help and promptly answer your questions. Please fill out the form to discuss your project and develop a tailored action plan.
Thank you, we have received your message. Our manager will contact you shortly.
Thank you, we have accepted your request. In the near future the responsible manager will contact you and clarify the details of the order.
Our experts are always happy to help and promptly answer your questions. Please fill out the form to discuss your project and develop a tailored action plan.
Thank you, we have received your message. Our manager will contact you shortly.